|
||
|
email constellations
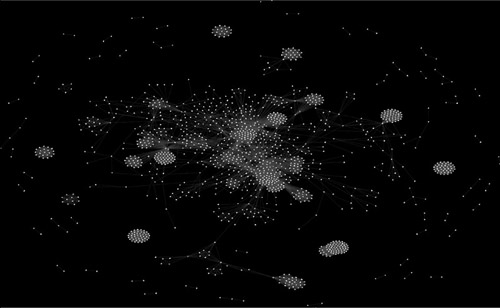
this project aims to be a free, flexible, and easily modifiable visualisation tool that allows a user to intuitively understand their online social group structure. projects that this software have been based on are social network fragments and buddy graph -- this code has all the functionality from its counterparts (except zoom) that could be implemented in a generic fashion. for example, colouring is not in this software as currently it is impossible to colour the graph without asking the user to classify his or her entire mail network manually; it is too hard to do automatic classification and colouring of e-mail addresses to include it in this version. it should be noted that this entire field of "who knows who" visualisations are not useful for anything except as a curiosity. the images produces from this program as well as the other similar ones are not useful as any real metric of who knows who. in the above example, the user's mailbox scanned has been relaxed into about 10 different social groups. by looking at To:, From:, and Cc: headers, this tool constructs a graph of who knows who. each "star" represents a person, and each "constellation line" draws out the relationship. this code falls under the gpl, so feel free to download the source or try one of the prepackaged releases. more detailed project information can be found on the project page hosted by sourceforge. the code is easy to compile and use. grab the source and with ant you can run ant dist to spit out a jar file that you can run as follows: java -jar econstellation.jar -s [imap server] -u [username] -p [mail password]. this will scan your current imap mailbox (and it should recurse through the mail directories) and construct a visual map (it will take a few hours for the picture to relax to anything coherent, the code has been written to be multithreaded, so a SMP machine will be faster than a single processor machine). the -i flag also allows you to "collapse" your e-mail addresses together; if you have more than one e-mail address, you can tell the visualiser to treat them are all the same by listing them all with -i flags on the command line. for more information, contact r. future development directions include some sort of automatic coloration method, a "zoom" feature, the ability to interrogate the graph for more information about the stars, and possibly a way to interact by taking a star and moving it to manually aid the relaxation of the graph. a faster relaxation engine could be useful too, however the one being used is a fairly speedy one using a spatial gridder that does a "gross" but visually correct relaxation. |
||
|
|
||